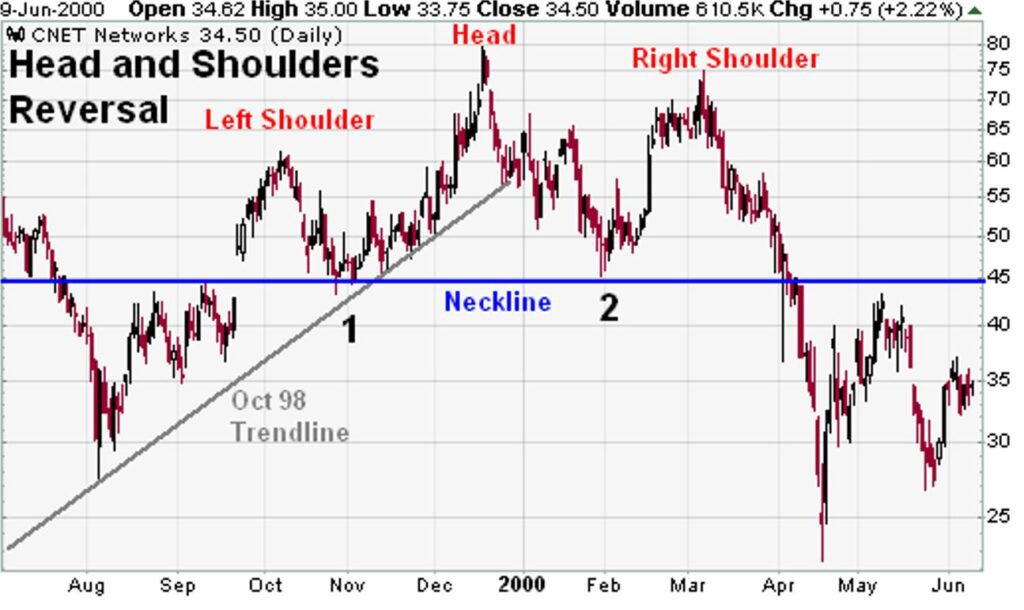
I would be amiss not to point something out about the use of charts in investing. Some of you may want to read this, using past movements of an asset’s price as the sole criteria – sole argument for predicting it’s future price movement is flawed – greatly flawed. However, charts are excellent for providing a historical picture of where something has been, and how it traveled to get there but they are useless for telling us where something is going next, in other words forecasting any price(s) into the future by merely observing its chart, in my opinion, is absolutely useless!
The use of charts in investing has been around forever. It depends on who you talk to, some strategists believe only in charts, utilizing a technique known as “Technical Analysis”, while others rely solely on “Fundamental Analysis”, focusing on “fundamentals criteria” for their investment predictions. Fundamental approaches basically include the whole kitchen sink, with the exception of charts and graphs, in an attempt to determine the attractiveness of a given asset. Macro Analysis, or Macro Economic Analysis, also referred to simply as “Macro Strategies” utilizes several variables in the macro economy to forecast future movements in an asset’s price, or even the attractiveness (or not) of holding an asset. I was always a Macro guy myself when I managed money and I still favor this approach today. However, in order to utilize a macro strategy one needs to be trained in economics, to have some understanding of the inter-relational impact that macro factors can have on sectors of the economy, or even across economies as a whole. And some strategists marry both technical and fundamental disciplines together to form a sort of hybrid approach for forecasting asset price movements, and formulating decisions on whether to buy, hold, or sell. You see this going on quite often as most large management firms employ strategists of both disciplines in order to provide their spins on market movements, as a way of satisfying both the technical and fundamental forecasting camps.
I like how these technical folks, these technicians explain what’s going to happen next to some asset simply due to some price pattern exhibited on a chart. Take the famous “head and shoulders” pattern, or the “double top”/”double bottom” formation, or even the “ascending” this and “descending” that patterns. They speak in terms of these chart patterns as if it’s all you need to know, I don’t think so. What I have found more useful are Wall St. monikers like “Dead Cat Bounce”, and it’s pure entertainment to watch this one play out. I don’t believe it was technicians who invented investment related terms like “Don’t try and catch a falling knife” and “Dead Cat Bounce”. These helpful terms most likely originated from a long time Wall Street investor and what a great description they provided in those particular situations.
Let’s take an asset’s chart, any asset really, and I’m only interested in its last closing price. Now what I want you to do is to predict for me where it’s going starting out of the gate tomorrow just by observing it’s last closing price. Can you do that for me? How about if I gave you a week or a month’s worth of closing prices, can you tell me where it’s going to close tomorrow? Why not? There’s absolutely no information embedded in an asset’s price alone, especially in the short-term. Now I will say there is one caveat to this, and I’m a huge believer – huge believer of the following argument, or thesis: over long periods of time an asset’s price does approach “fair value”, that is it will eventually find it’s “equilibrium” price (be that attractive to an investor or not), all assets do approach their correct value over time via open and free markets. Whether that’s attractive to investors at that juncture doesn’t really matter, it’s immaterial. But investors aren’t paying for that, what they want to know is whether or not a given asset is going to appreciate or depreciate next, and for how long? That’s what they want to know and believe me it’s impossible to project with exacting probability, given any (known) technique really. I will say that in my opinion, technical analysis is as useless a predictor as waving one of those Y-shaped sticks above the ground to indicate where a speculator should drill for oil. 🙂


How many times did I hear that gold was going to $5,000/ounce 10 years ago? How many? At least a dozen. They derived their forecast from the charts. Dow @ 35,000 next, circa 1997, not 2017. Charts are a great way to spend your market fantasies, they carry no useful information forward. They carry accurate past information only, market strategists confuse these two concepts – one does not equal the other.
Who would invest in that chart?
Where’s the RSI?
Money flow?
Pivots?
50 & 200 day SMA?
Fibonacci? (I use standard pivots)
Is that a gap up on the left? Yes it is. Anyone who looks at charts would notice that immediately. Stocks tend to fill up gaps. I see a jacked up M formation or an inverse head and shoulders. Add that to Macro (Greenspan raising) and I’m out.
Anyone who charts won’t go into a bad neighborhood (sector) nor would they not look for a level of support. Chaiken uses both fundamental and technical analysis, he’s damn good.