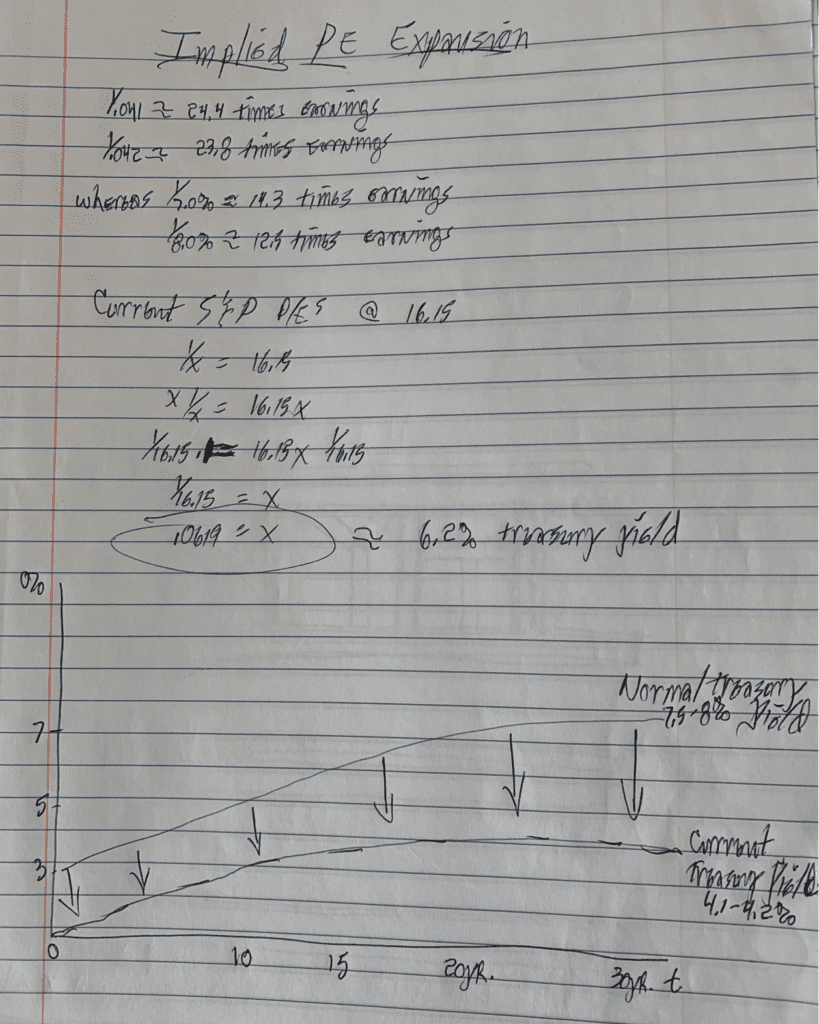
I was clearing my desk for a new housekeeper, I wouldn’t want to put anyone through all the stuff piled up on my desk at home. In one stack I came across a notebook I had brought home from work a couple years ago. Curious about what was in it, I opened it to find this, something very relevant to conversations we’re having, witnessing today. I was thinking I should write a post about the theory of Implied P/E ratios – literally 2-3 hours ago! And here it is, what are the chances of that happening? Some mathematician first proposed this model as a predictor of the Price-to-Earning’s ratio, (P/E), for a basket of stocks. I can’t remember his name. His model calculates an “implied” Price to Earnings Ratio using the inverse of the current 10-yr. Treasury Yield. Good stuff, a simple and straightforward predictor. However, does the P/E Ratio on a basket of stocks behave in step with this model? Sometimes but why not all the time? There are a ton of investors that will tend to, over time, ignore prediction tools like this for various reasons. First of all, where prices can go on a basket of any securities is never an exact science. However, I wouldn’t interpret that to mean that this particular valuation model is not valid.
At this writing, the yield on the 10-yr. U.S. Treasury Bond is hanging (mostly) around a 1.5% yield. Some days it falls below that level while other days it can be a bit higher, but generally speaking it’s a pretty benign yield. If one were to look at 10-yr. yield over long periods of time, it’s never really traded much lower than where it is today, ever! For years the yield on this intermediate term paper was in a range between a 4.5% to 6.5% handle. During high inflationary periods the yield on 10-year Treasury paper has climbed well above 10%. However, let’s just take the case where it was yielding 4.5%/year, then using our Implied P/E predictor, at what valuation should the stock market be trading at in P/E terms? Around 22 times earnings according to the model. Seems pretty reasonable to me. Stock market P/Es have commonly traded in this range lately though it is considered slightly elevated from historical standards (I said slightly), whereas a P/E ratio of say, 10-12 times earnings could be interpreted as a relatively cheap, or undervalued, stock market. But again that’s in comparison to where the 10-year yield is – so working backwards if the stock market P/E ratio is 10-12 times earnings then the 10-year annual yield on U.S. Treasuries should be in the 8.33% to 10.0% range (according to this model). In other words, stock market valuations should be depressed in this particular case because Treasury yields are elevated, get it? Comparing that to today, again, we have some of the lowest bond yields in the history of this country, (which is why I think it’s important to visit this subject), with the 10-year Treasury yielding a paltry 1.5%/year. Thus, according to this model our U.S. stock market could be as pricey as 66 times earnings and still be “reasonable”? Have we ever witnessed our U.S. market that pricey? Probably never for the entire S&P 500 companies, but many individual companies listed on exchanges these days are quite pricey today, with P/E ratios exceeding the 66 times earnings level.
I heard last week that the current P/E ratio for the S&P 500 companies are sitting at 29 times earnings, so valuations are, historically, elevated but not even close to the 66 handle that this model says could be reasonable given our depressed interest rate environment. According to this model, the 10-year Treasury yield could climb to 3.44% and theoretically a stock market valuation at 29 times earnings could still make sense. The most expensive market valuation I can remember occurred in late 1999 when the S&P 500 companies were priced at a whopping 40 times earnings, a valuation level that anyone in the industry would admit was rich. And where were 10-year Treasury yields at that time? In the range of around 8% which means, according to this model, a more reasonable valuation for the U.S. stock market should have been closer to 12.5 times earnings. So the model was flashing warning signs back then, though I seriously doubt many were listening? It wasn’t many months later, in early 2000, when the U.S. stock market began its decent and entered what would prove to be a cruel bear market which lasted more than two years. The U.S. stock market finally bottomed out in May-June of 2002.
I believe this type of diagnostic tool is useful if only to test whether something makes sense or not from a valuation perspective, but often over time these types of valuation measures will tend to get brushed aside, especially when they conflict with investor motives… and that’s most likely when the danger begins?
Clear Your Desk And It’s Amazing What You Find!

Clear Your Desk And It’s Amazing What You Find!
0
0
votes
Article Rating
Subscribe
Login
0 Comments
Newest
Oldest
Most Voted
Inline Feedbacks
View all comments
