
Forward: Here’s one in-depth look at everything but the “whys and wherefores” of investing in Gold, with facts and figures brought to you by a personal friend of mine and smart colleague, Jeff Page. Yes Gold is pretty but have you ever stopped to think things through like how to get rid of that physical gold [coins] your Aunt Betty left you when she died? Sure, you can take them to a rare coins dealer or one of many precious metals brokers. Guess what it’s going to cost you to liquidate those? Uh 1%? God No! 10%? No, keep going! It’s going to cost you between 15 and 20% of the spot value Gold price [the day of liquidation] to turn what your Aunt so coveted into spendable cash. For more on the subject of “but it’s so shiny” I strongly suggest you read Jeff Page’s analysis below –

Introduction
The year 1975 marked a pivotal moment in financial history. After decades of government restrictions, American citizens were once again permitted to own gold bullion as of January 1, 1975.1 At that time, gold traded at an average price of $160.87 per troy ounce,2 while the S&P 500 index closed the year at 90.19 points.3
Five decades later, both assets have experienced dramatic appreciation, but at vastly different rates. This analysis examines not just the nominal returns, but also inflation-adjusted performance, decade-by-decade trends, and the impact of dividend reinvestment—factors critical to understanding true wealth creation over long-term investment horizons.
Historical Price Performance
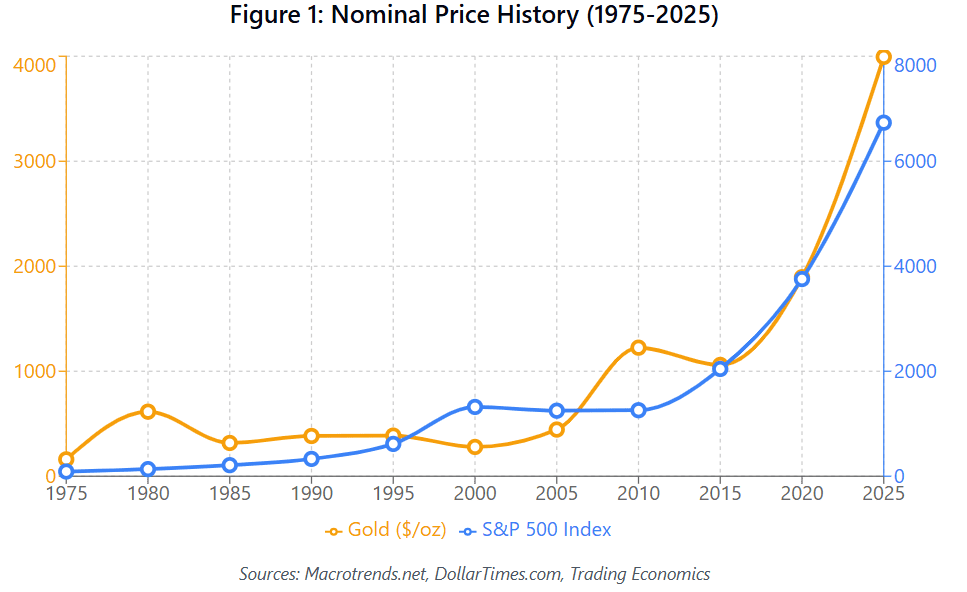
Figure 1 displays the nominal price movements of both assets from 1975 to 2025, demonstrating the exponential growth trajectory of the S&P 500 compared to gold’s more volatile but ultimately lower returns.
Growth of $100 Investment
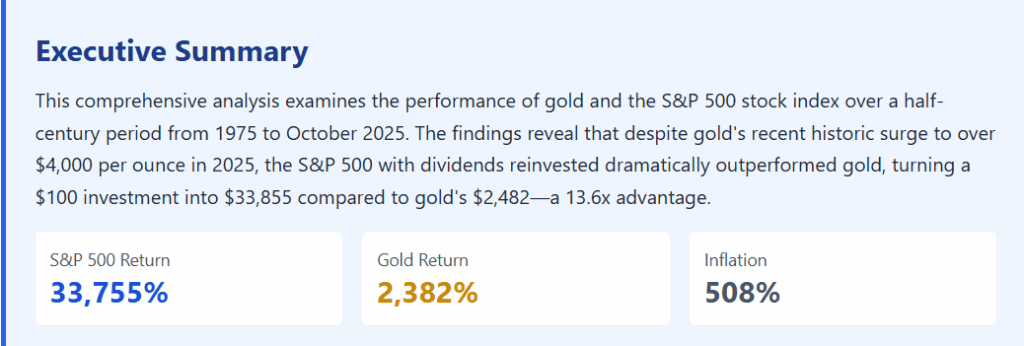
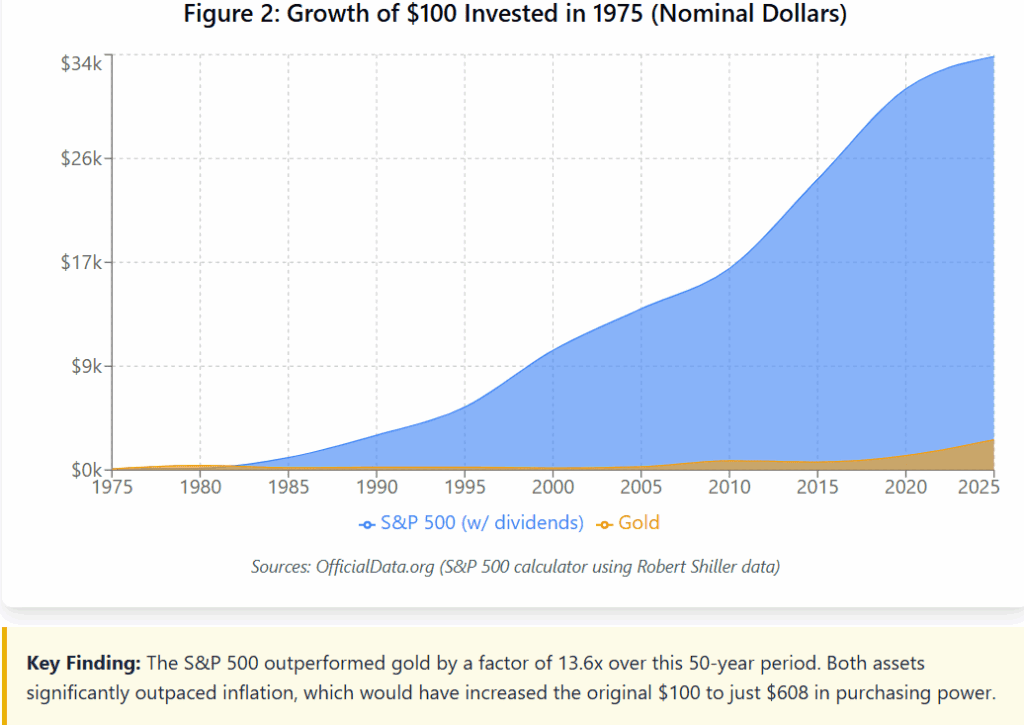
The true power of long-term investing becomes evident when examining the growth of a hypothetical $100 investment made in 1975. Figure 2 illustrates how the S&P 500, with dividends reinvested, transformed this modest sum into $33,855 by October 2025, while the same investment in gold grew to $2,482.4
Decade-by-Decade Performance
Breaking down the performance by decade reveals periods of divergent performance. Gold excelled during the inflationary 1970s and the commodity boom of the 2000s, while the S&P 500 dominated during most other periods.
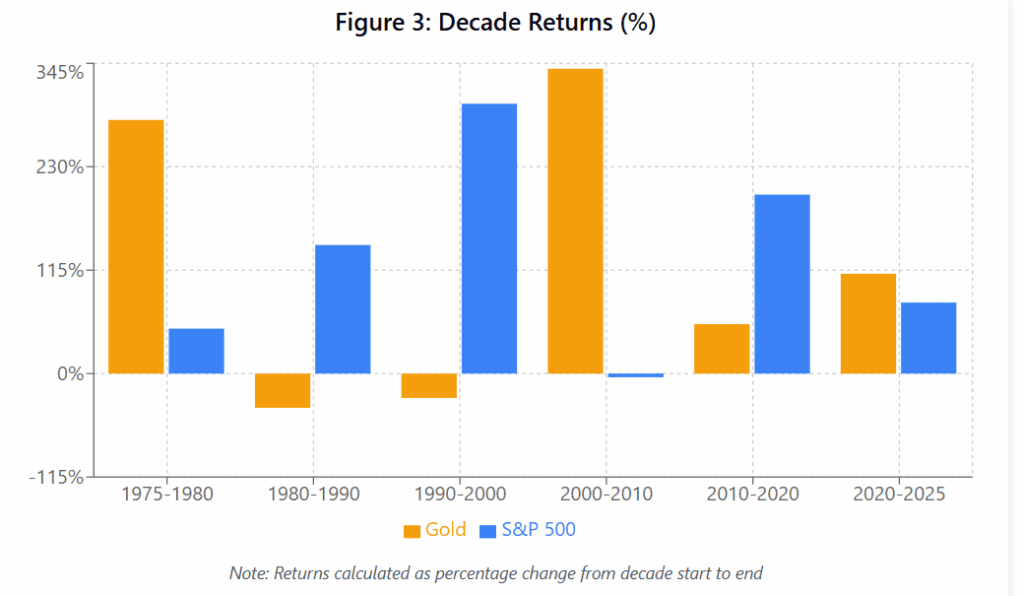
Notable Periods:
- 1975-1980: Gold surged 282% as inflation ravaged the economy and the price spiked to $850 in January 1980.5
- 2000-2010: Gold rose 339% during the dot-com bust and financial crisis, while the S&P 500 was essentially flat (-4%).
- 1990-2000: The tech boom propelled the S&P 500 up 300% while gold fell 27%.
- 2020-2025: Gold has risen 111% in this period, including a remarkable 50% surge in 2025 alone, reaching record highs above $4,000/oz.6
Real Returns: The Inflation Picture
Nominal returns can be misleading without considering inflation’s erosive effect on purchasing power. Figure 4 shows inflation-adjusted returns, revealing that while both assets preserved and grew wealth in real terms, the S&P 500’s advantage remains substantial.
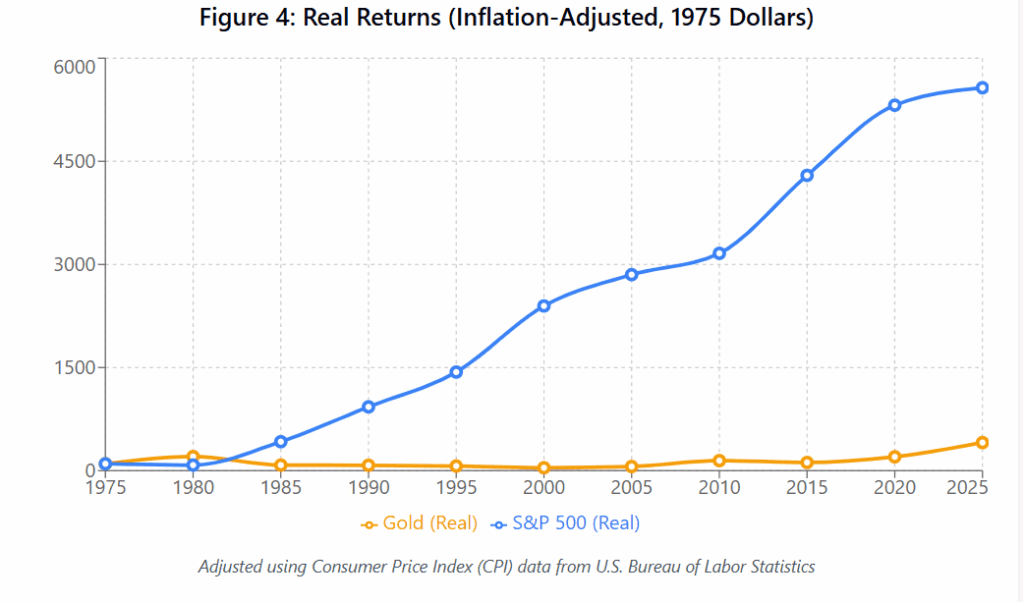
In real terms, $100 invested in the S&P 500 would have the purchasing power of $5,570 in 1975 dollars today, compared to gold’s $408.7 This demonstrates that the S&P 500 not only preserved wealth but created substantial real returns even after accounting for five decades of inflation.
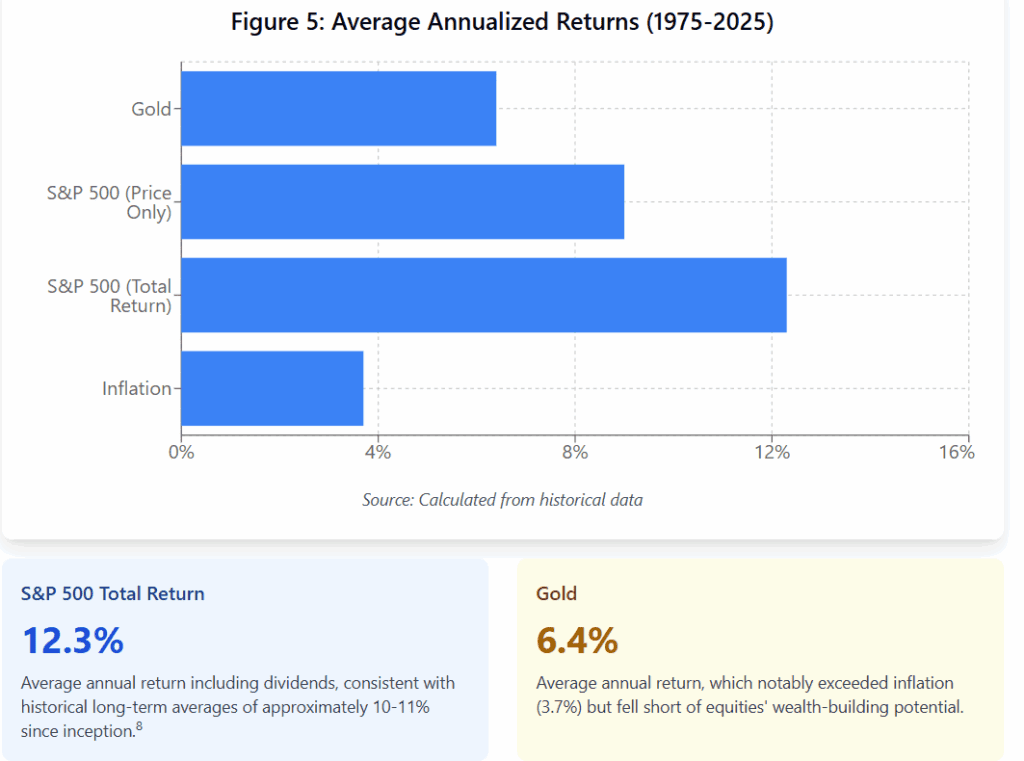
Annualized Returns Analysis
Breaking down returns into annualized figures provides a clearer picture of compound growth rates over this 50-year period.
The 2025 Gold Rally in Context
Gold’s 2025 performance has been extraordinary by any measure. The precious metal surged approximately 50% from the start of the year through October, reaching unprecedented heights above $4,000 per ounce for the first time in history.9 This rally has been driven by multiple factors:
Drivers of Gold’s 2025 Rally:
- Economic Uncertainty: Concerns about inflation, recession risks, and the U.S. government shutdown have driven investors to safe-haven assets.
- Dollar Weakness: The dollar index has fallen 10% in 2025, making gold more attractive to international buyers.10
- Central Bank Buying: Countries including China, India, and Germany have increased their gold reserves significantly.
- Geopolitical Tensions: Ongoing global conflicts and trade disputes have reinforced gold’s role as a crisis hedge.
Despite this remarkable recent performance, gold’s 2025 surge has not fundamentally altered its long-term underperformance relative to equities. Even with prices at $4,000/oz, a 1975 gold investor would still trail their S&P 500 counterpart by a factor of 13.6x.
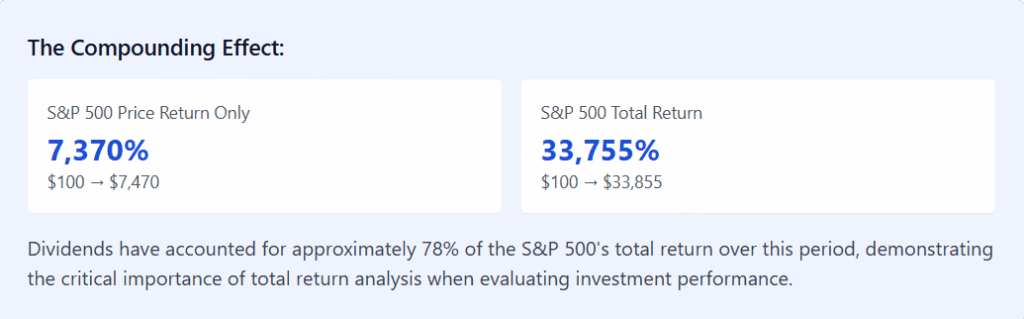
The Dividend Advantage
One of the most significant factors explaining the S&P 500’s outperformance is dividend reinvestment. While gold generates no income, S&P 500 companies have consistently paid dividends that, when reinvested, compound returns dramatically over time.
Investment Implications and Considerations
1. Long-Term Wealth Building
For investors with multi-decade time horizons, this analysis reinforces that diversified equity ownership has been the superior wealth-building strategy. The S&P 500’s compound annual growth rate of 12.3% has consistently outpaced both inflation and alternative assets.
2. Portfolio Diversification
While gold underperformed over the full period, it has provided valuable diversification benefits during specific crisis periods (1970s inflation, 2008 financial crisis, 2020 pandemic). Financial advisors like Ray Dalio have recently recommended allocating approximately 15% of portfolios to gold as a hedge against traditional asset volatility.11
3. Inflation Protection
Both assets provided substantial inflation protection over the 50-year period. Gold’s 6.4% annual return exceeded inflation’s 3.7% average, while stocks’ 12.3% return far outpaced rising prices. However, stocks proved to be the superior inflation hedge over the long term.
4. Volatility and Risk
Gold exhibited significant volatility, with multiple periods of substantial decline (notably 1980-2000). The S&P 500 also experienced major drawdowns during bear markets but consistently recovered to new highs. Long-term investors who maintained discipline were rewarded in both assets.
5. The Current Environment
As of October 2025, both assets face unique circumstances. Gold is at all-time highs with potential for consolidation. The S&P 500 has reached 6,735, also near record levels, though concerns about high valuations (P/E ratio at 21.7x) suggest more modest future returns may be ahead.12
Conclusion
This comprehensive 50-year analysis demonstrates that while both gold and the S&P 500 have provided positive real returns and wealth preservation, equities have been the dramatically superior vehicle for long-term wealth creation. An investor who placed $100 in an S&P 500 index fund in 1975 and reinvested dividends would have 13.6 times more wealth than an investor who purchased gold.
Gold’s 2025 rally to record highs above $4,000 per ounce represents a remarkable achievement and validates its ongoing role as a safe-haven asset during periods of uncertainty. However, even this historic performance has not fundamentally changed the long-term calculus: diversified equity ownership, with patience and dividend reinvestment, has been the path to optimal wealth accumulation over generational time periods.
Key Takeaway:
Past performance does not guarantee future results, but history suggests that a balanced approach— maintaining a core equity position while allocating 5-15% to gold for diversification and crisis protection—may offer the optimal risk-adjusted returns for long-term investors. The data overwhelmingly supports equity ownership as the foundation of wealth-building portfolios, while gold serves an important but complementary role.
Sources and References
1 SD Bullion. “Gold Prices 1975.” Available at: https://sdbullion.com/gold-prices-1975
2 DollarTimes. “1975 Gold Price in Today’s Dollars.” Available at: https://www.dollartimes.com/inflation/items/price-of-gold-in-1975
3 StatMuse Money. “S&P 500 Price History 1973-1975.” Available at: https://www.statmuse.com/money/ask/sandp-500-price-history-in-1973-to-1975
4 OfficialData.org. “S&P 500 Returns since 1975.” Calculated using Robert Shiller’s data methodology. Available at: https://www.officialdata.org/us/stocks/s-p-500/1975
5 Maguire Reference. “Gold Prices 1792-1973.” Historical price documentation.
6 Trading Economics. “Gold Price October 10, 2025.” Available at: https://tradingeconomics.com/commodity/gold
7 Calculated using CPI data from U.S. Bureau of Labor Statistics. CPI in 1975: 53.800; CPI in 2025: 323.976.
8 Wikipedia. “S&P 500.” Historical performance data. Since inception in 1926, compound annual growth rate including dividends has been approximately 9.8%.
9 CNBC. “Gold price reaches $4,000 an ounce for the first time ever.” October 7, 2025.
10 CNBC. “Stock market today: live updates.” October 1, 2025. Reports dollar index down 10% for 2025.
11 CNBC. “Gold price reaches $4,000 an ounce.” Ray Dalio recommendation at Greenwich Economic Forum, October 2025.
12 Goldman Sachs. “The S&P 500 is expected to return 10% in 2025.” Research report noting P/E multiple of 21.7x ranking at 93rd historical percentile.
About the Author
Jeffrey W Page, Sr is a financial analyst specializing in long-term investment performance analysis and asset allocation strategies. This analysis was completed on October 10, 2025.
Disclaimer: This analysis is for informational and educational purposes only and should not be construed as financial advice. Past performance does not guarantee future results. All investments carry risk, including the potential loss of principal. Readers should consult with qualified financial advisors before making investment decisions.
Thanks again!
You bet, I liked the message, very helpful stuff!